CE 351 Spring 2023
Lab 6 Photo PID
Name: Mason
Brady
Email:
mrbrady1@fortlewis.edu
Photo PID
Introduction:
Using a PID loop to stabilize LED brightness
Materials:
Photocell, LED, arduino
Methods: First the esp32 on-baord light was programeed to blink to ensure communication with the esp32, this can be seen linked below.
https://youtube.com/shorts/fwQNritQ_Uw?feature=share
Next, a MPU6050 was wired to the esp and the 3 axis accelerometer data was read to the serial monitor as seen below in Figure 1.
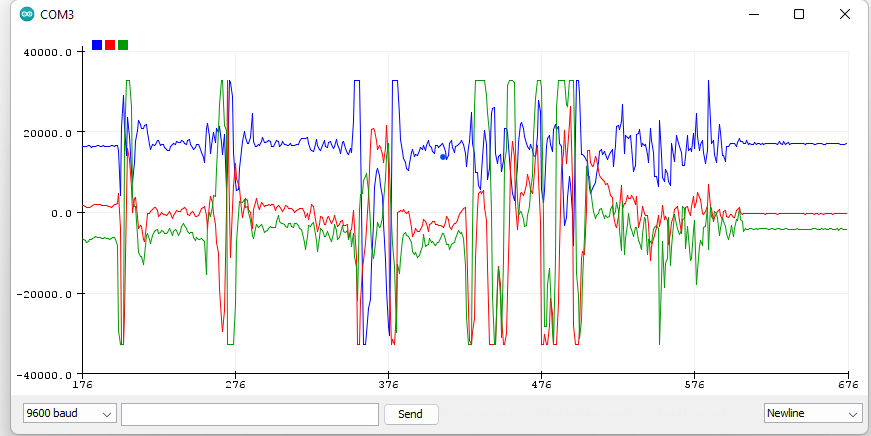
Figure 1. Accelerometer raw data.
This data was then convereted into the G scale as seen below in Figure 2.
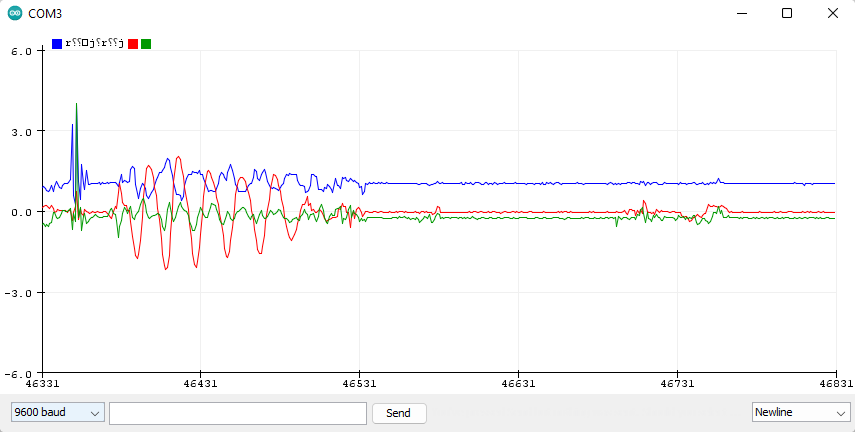
Figure 2. G-Scale accelerometer data.
I
then tried to write the data to SD card, the SD card reader connected
but was unable to read my SD card because it was formatted in exFat
which is not supported by arduino. I tried to reformat the drive but
windows 11 no longer supports formatting to Fat32 for some reason and
the third party formatting program I downloaded was infact not free :(.

Figure 3. ExFat Formatting
Even
though my SD card wasn't working I moved on to writing the code to
write three files and convert them to the +- 4g range to the sd card
which can be seen below in Figure 4.
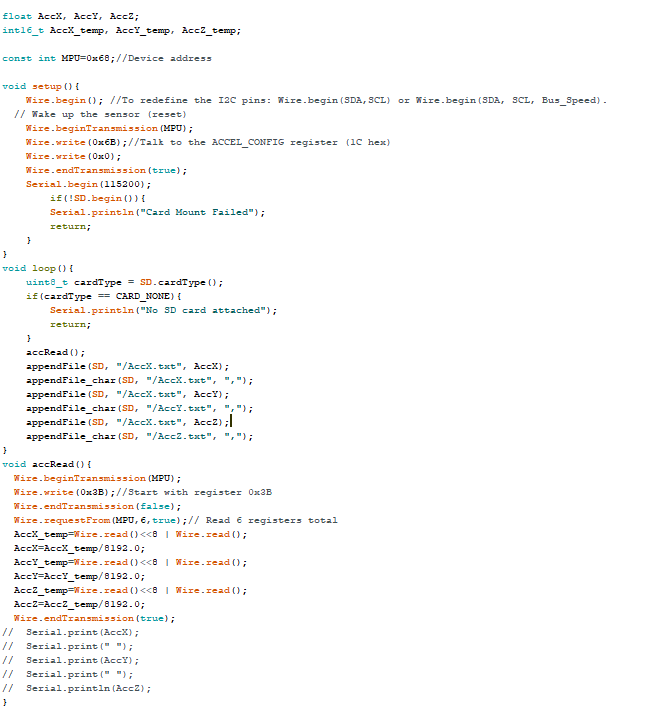
Figure 4. Writing data to 3 seperate files
OFinally,
was communicating between two esp32 modules. I got the mac adresses and
followed the tutorial to write data from the MPU through SPI to the
master board and then sending the data to the corresponding mac adress
of the slave board which wrote the data to the sd card reader. A photo
of the full circuit infront of the communicating graph can be seen
below in Figure 5.
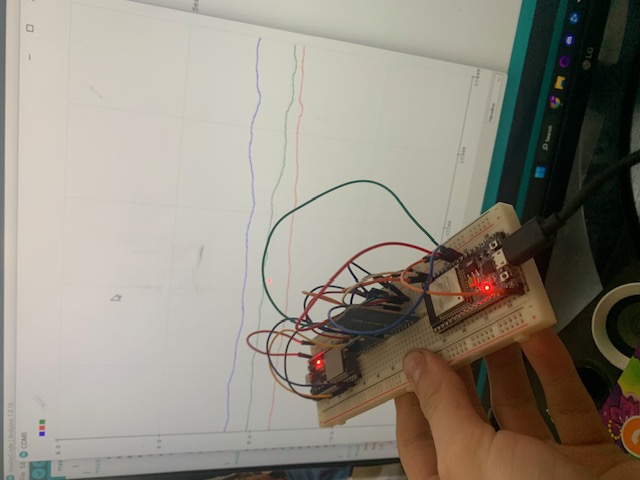
Figure 5.
Master board with MPU6050(Far) wirelessly sending acceleration data to
slave board with SD card reader(close) and plotting through slave
serial monitor.
The code was then modified to export to an SD card and cleaned up, the final code can be seen below in Figure 6.
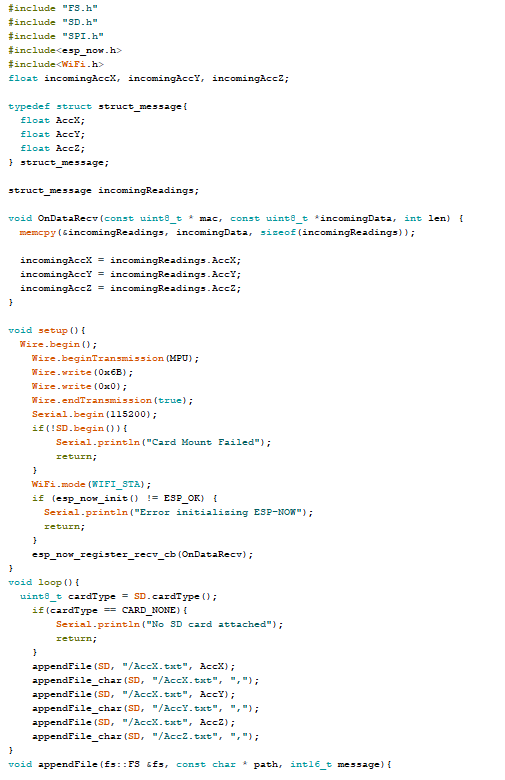
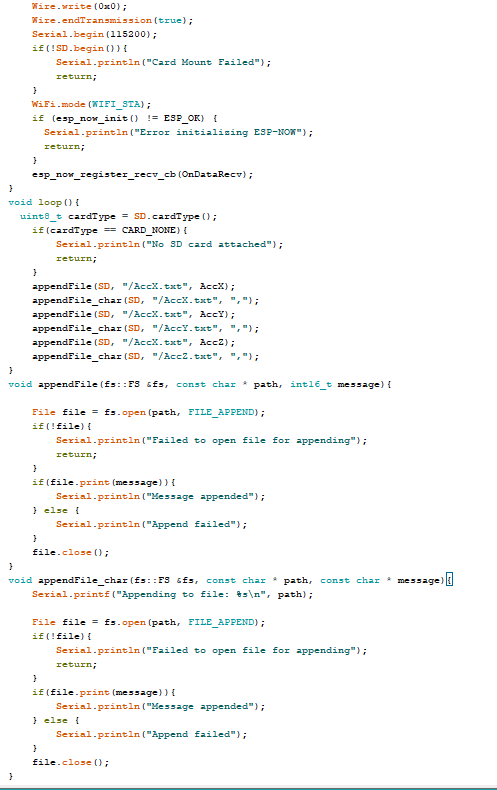
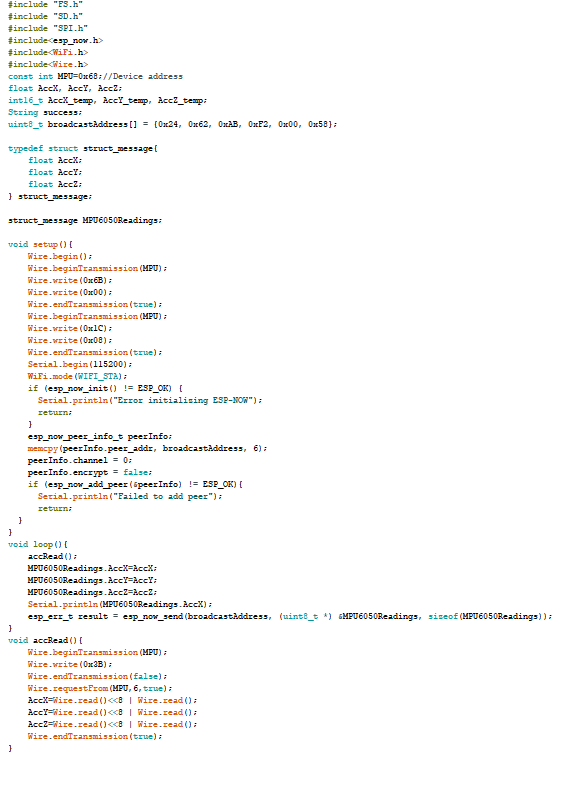
Figure 6. Cleaned
up code with SD card writing Left 2 screenshots are the receiving code
which writes to a file and the right screenshot shows sending code.
Finally, the data was plotted in Python as seen below in Figure 7.
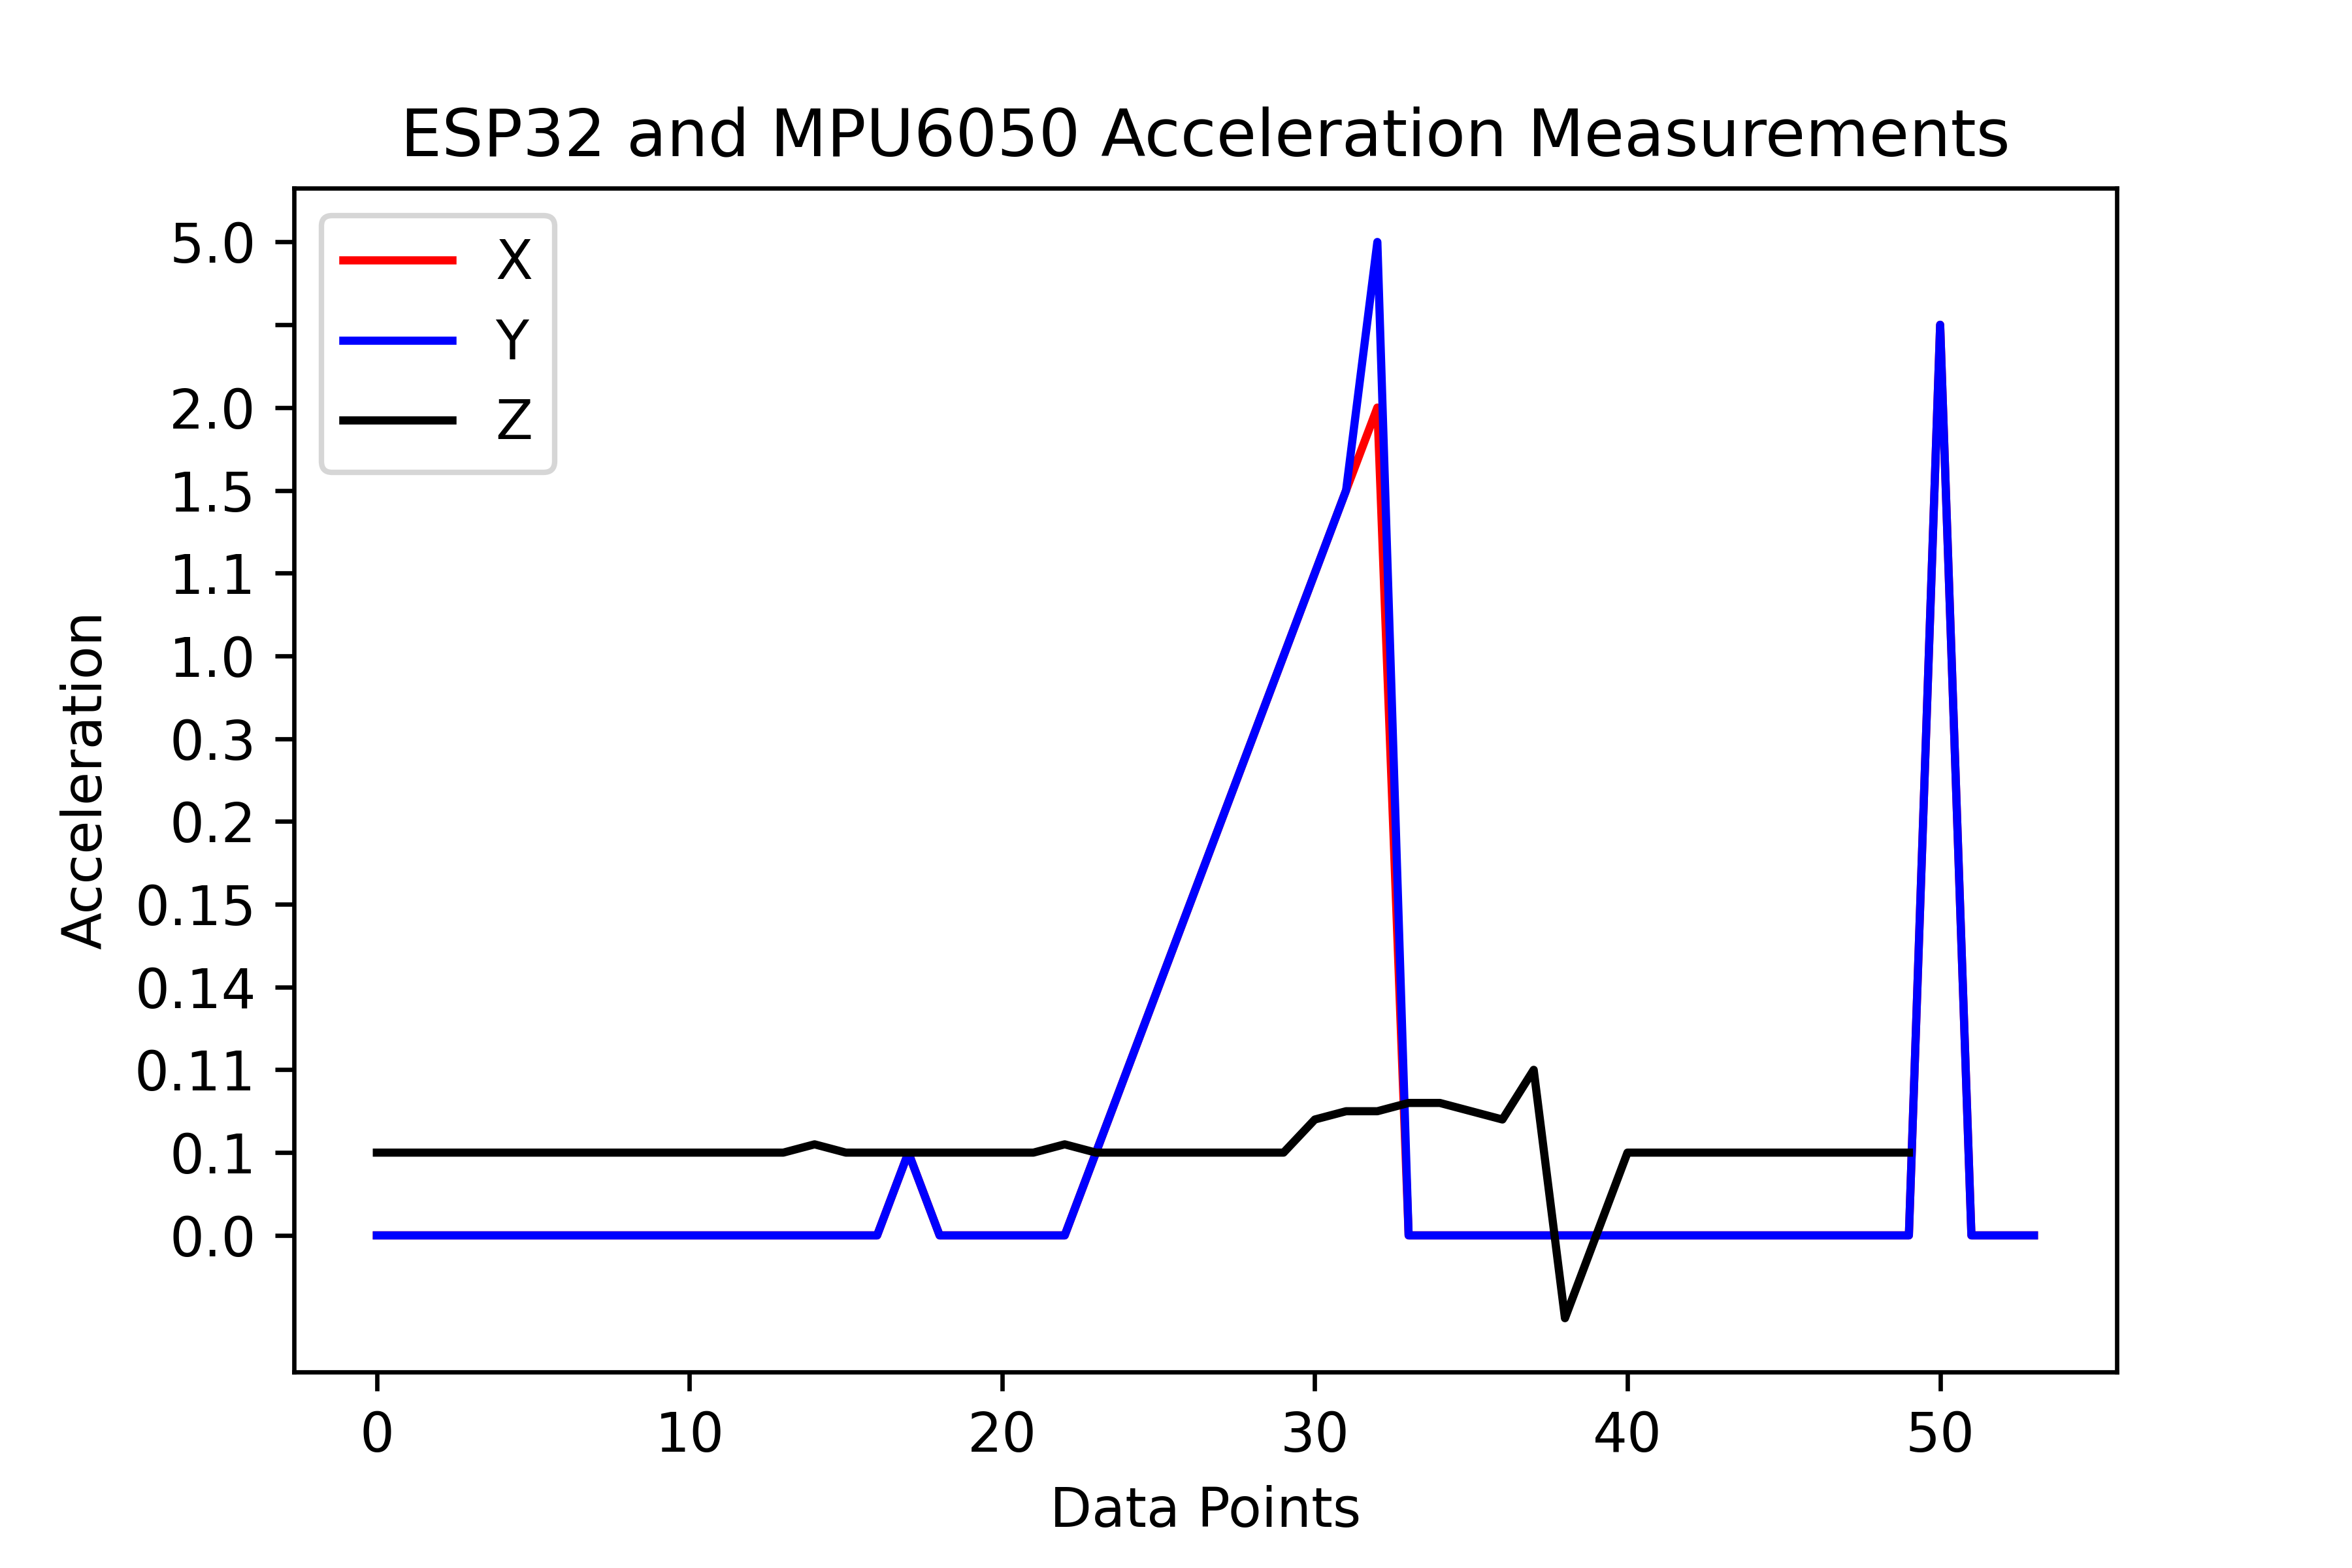
Figure 7. Data plotted in python