ENGR337 Lab 2020 Spring
Lab 4 xxxxxx
Name:
Orion Clay
Email: oeclay@fortlewis.edu

1. An Oximeter

2. In this lab, students constructed a circuit that utilizied the filters and amplifiers from lab three as well as a IR emitter and reciever to create an oximeter. The oximeter was used to monitor student blood oxygen concentration
by measuring how much IR light was absorbed through a fingertip. Heart rate was also monitored as it corresponded with thefrequency in between voltage peaks in the reciever. Students saw how basic analog circuits were applied in a practical, real-world application.

3. Materials
Tektronix MSO 2022B Mixed Signal Oscilloscope and Probe
Multimeter probe (for circuit debugging)
One TCRT5000 IR Emitter and Reciever Pair
Two 1NA 128P Instrumentation Amplifier Bread Board
One 680 Ohm Resistor
One 2 Volt Zener Diode
One 4.7 uF and One 458 nF Capacitors
One 741 Operational Amplifier
0-5 Volt ADC Converter (For Power Supply)
Three 1k Ohm Resistors One 68k Ohm Resistor
One 680 Ohm Resistor One 10k Ohm Resistor One 560 Ohm Resistor
One Arduino Uno Board
Arduino Software (For Serial Monitoring)


**All cables necessary for taking measurements with the above devices were used in this lab.**

Methods
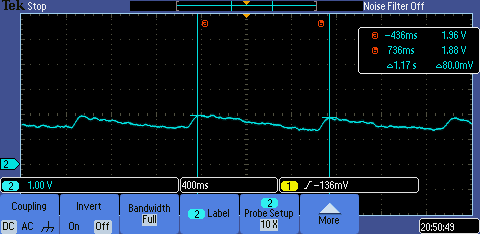
Students began by reviewing the data sheets provided by Dr. Li regarding the IR emitter and reciever and the instrumentation amplifier. After students familiarized themselves with the pin layout, direction, and other relevant information they began to construct the cirucuit. The circuit schematic was also provided by Dr. Li and contained low pass filter wired to an instrumentation amplifer followed by a  high pass filter and another instrumentation amplifier, and finally a 741 configured as a comparator for the signal output. This process took time to configure correctly and more still more time to debug. Once the circuit was verified to be correct, students tested their blood conentration levels as well as their heart rate by placing their pointer finger over the IR emmiter and reciever. The results were viewed in an oscilliscope and captured as a screenshot. An Arduino Uno board was introduced to the circuit for Task 2 and embedded with a code that allowed students to view their heart rate through the Ardunio serial monitor on a desktop computer. A video of the serial monitor was taken and uploaded to their final reports.

4. Results


  Figure 1. The circuit schematice for Task 1 provided by Dr. Li.


Figure 2. The oscilliscope monitor displaying the oximeter readings as well as the amount of time in between my heart beats.


Figure 3. The Arduino code used to view the real-time voltage output in the serial monitor.


Figure 4. The video of my heart rate being displayed in the Arduino serial monitor.

5. Discussion
The practial applications of analog circuits became apparent to students upon finishing this lab. Low pass, and high pass filters as well as amplifiers can be extremely useful in the real world. Displaying ECG signal at a hospital or doctor office can  be extremely important to the well being of patients and it is thanks to analog circuit design a device such as an oximeter can be made to function. The set up and debugging of the circuit was also extremely helpful to students as they continued to develop their wiring and troubleshooting skills. It was very intruiging to see my resting heart rate. It was much lower than I expected it would be, around 1.17 seconds between each beat which correlates to around 50 beats per minute. It was also interesting to see that my heart beat did not genereate a large signal in the oscilliscope probe. My hands were cold that afternoon and that may have affected the IR emitters ability to effectivley interpret my blood oxygen concentration.