ENGR337 Lab 2020 Spring
Lab 1 xxxxxx
Name:
Orion Clay
Email: oeclay@fortlewis.edu

1. LTSpice Introduction and Lab Report Setup

2. In this lab students familiarized themselves with LTSpice circuit simulation software as well as created their lab webpages for posting lab reports. Students learned how to create circuits in LTSpice using both text file codes as well as .op codes. Various functions within LTSpice were used to calculate voltages and currents over resistors as well as time delays for RC circuits. Students also their refreshed physical measurement skills by taking multimeter measurements of a circuit constructed on a breadboard.
Lab pages were created and set up on yilectronics.com after students completed the lab.

3. Materials
Multimeter and Probe Cables
Bread Board Three 2k Ohm Resistors Three 3k Ohm Resistors
Wall Outlet DC Voltage Adapter LTSpice Software MATLAB Software (for quick mesh current calculations)


Methods
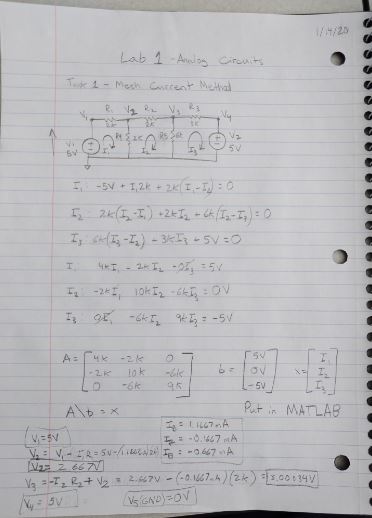
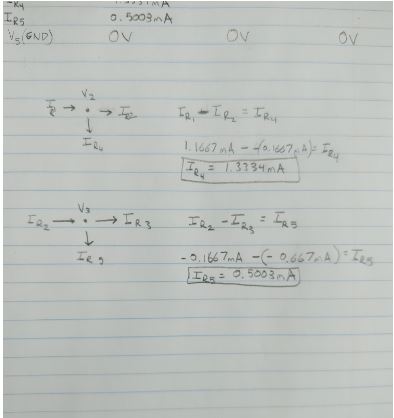
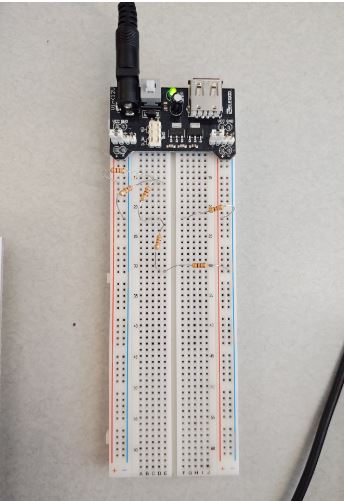
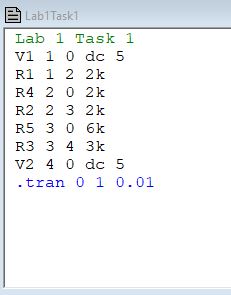
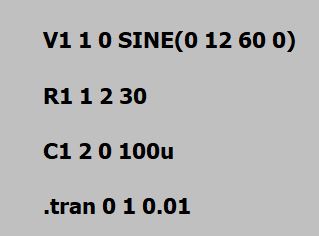
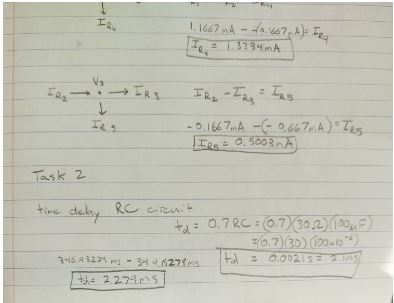
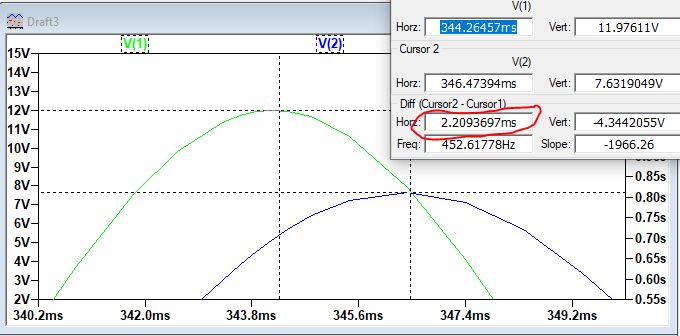
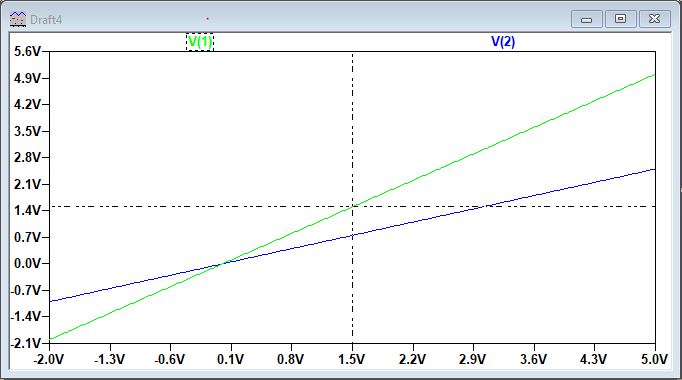
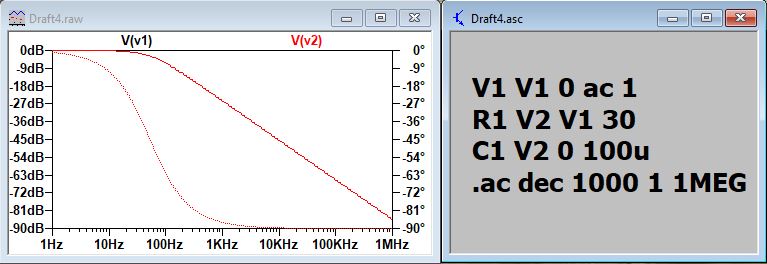
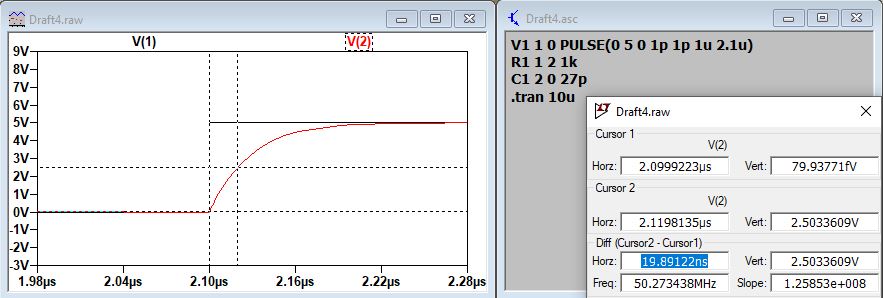
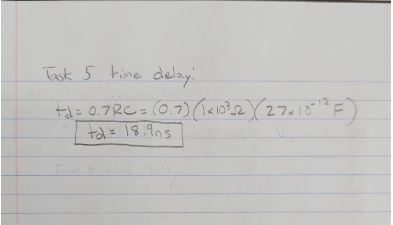
The lab began with Task 1 where students created a text file to code a circuit containing two five volt voltage sources and 5 resistors of varying ohmic values. The text file was imported into LTSpice and run to simulate voltage values at certain nodes within the circuit. The current through each resistor was also simulated. The circuit was then drawn on paper and the voltages and currents were calculated using mesh current method. The circuit was then built on a bread board and the voltages and currents were measured with a multimeter. All the data was tabulated in a table (see Results section). Task 2 involved creating a .op file in LTSpice for an RC circuit. The time delay and input and output voltage were simulated and displayed on a graph in LTSpice. Task 3 had students create another circuit with a .op file and simulate a DC sweep from negative two volts to 5 volts and display them on a graph. For Task 4 students created another .op file and conducted an AC sweep on the circuit. The results were displayed in a graph. The lab ended with Task 5 where an RC circuit was coded in LTSpice and a DC pulse was conducted. The time delay of the circuit was simulated and compared to a hand calculation.

4. Results


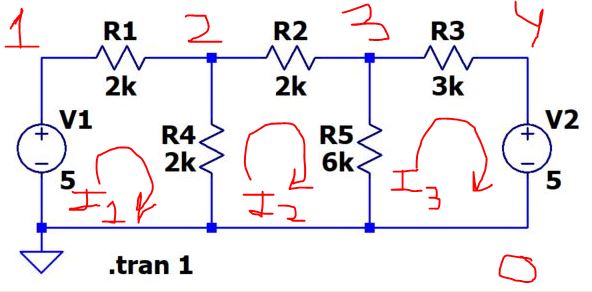
Figure 1. The circuit used in Task 1 with labeled voltage nodes and currents provided by Dr. Li.

5V
Figure 2. The hand calculations done to find the voltages and currents at each node and through each resistor respectively.


Figure 3. The continuation of the hand calculations to find the final currents through resistors 4 and 5 using KCL.


Figure 4. The physical circuit constructed on a bread board. The voltages and currents were measured using a multimeter.


Figure 5. The text file used to create the Task 1 circuit in LTSpice. This code was ran and tested within LTSpice with currents and voltages recoreded in Table 1.

Table 1. The voltage and current values for the three methods used for calculation (hand, multimeter, and LTSpice). All values were very similar with a slight difference in the actual currents and voltages measured by the multimeter when copmared to both the calcuation and simulation methods.

Hand Calculation
Multimeter Measurement
LTSpice Simulation
V1 5 V 4.97 V 5 V
V2 2.667 V 2.65 V 2.667 V
V3 3.0003 V 2.99 V 3.000 V
V4 5 V 4.97 V 5 V
GND 0 V 0 V 0 V
IR1 1.1667mA 1.150 mA 1.1667 mA
IR2 0.1667 mA
0.165 mA 0.1667 mA
IR3 0.667 mA 0.667 mA 0.667 mA
IR4 1.3334 mA 1.314 mA 1.333 mA
IR5 0.5003 mA 0.500 mA 0.500 mA


Figure 6. The LTSpice .op code used to generate the RC circuit for Task 2.


Figure 7. The hand calcuations done to find the time delay of the RC circuit.


Figure 8. The LTSpice simulaiton showing the RC circuit time delay.


Figure 9. The LTSpice .op code used to create the circuit used in Task 3.


Figure 10. The graph of the DC sweep conducted in Task 3. The sweep was conducted on the input voltage (V1) and varied from -2 V to 5 V. V2 shown on the graph in the output voltage of the circuit.


Figure 11. The LTSpice .op file used to create the circuit for Task 4. The graph shows an AC sweep conducted on the input voltage (V1) and the resulting output voltage (V2). The frequency varies from 1 Hz to 1 MHz along the x-axis.


Figure 12. The LTSPpice .op file used to create the RC circuit used in Task 5. The graph displays the input voltage (V1) and output voltage (V2) of the circuit after conducting a DC pulse upon it. The time delay is also shown.


Figure 13. The hand calcuations done to show the time delay of the RC circuit. This was verified by the LTSpice simulation.

5. Discussion

This lab was a nice and necessary refresher for students on key concepts they learned in their Circuits one courses. It also allowed students to refresh in their minds the method of lab page uploading required for success in this class. The different abilities of LTSpice were reintroduced and reinforced in the minds of the students and the hand calcuations allowed students to practice important concepts such as the use of KCL and the mesh current method. Students will make use of these practices as well as LTSpice throughout the semester. They will need to become compentent in them in order to comprehend analog circuits course content and be successful in the class.