A Heart
Rate Monitoring System
1. The
Heart Rate Sensor Module MAX30102 / Pulse Detection Blood Oxygen
Concentration Calculation Module was ordered from
Amazon
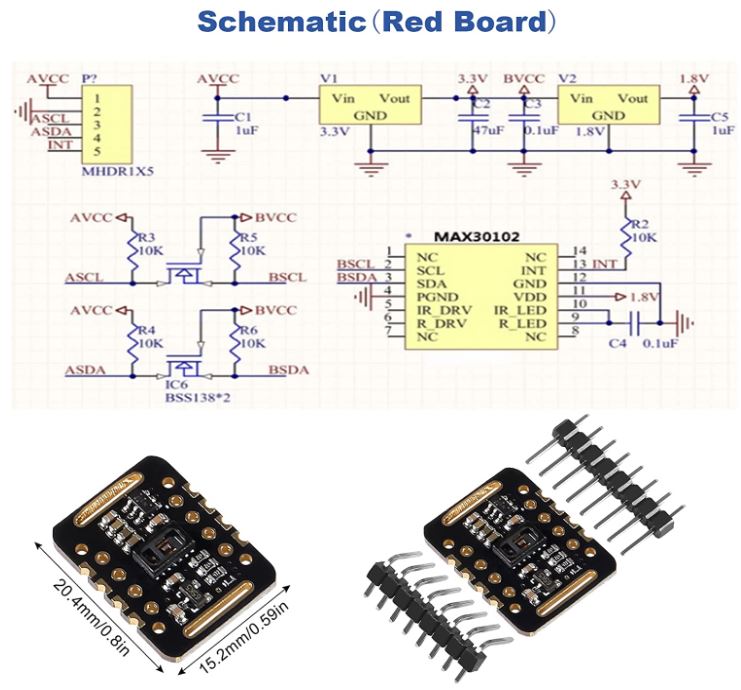
From the schematic, you can
find that:
1. There are two voltage
regulators, the output are 3.3V and 1.8V respectively. It seems that
the MAX30102 requires these two voltages to operate.
2. The ASCL and ASDA pins are
the two pins for the I2C communication port. We will use I2C
extensively later this term but now, you just need to use the library
in Arduino to make it work.
3. R3 and R4 are pull-up
resistors, there are required by the I2C port.
4. BVCC is 3.3V and they
opened up the NMOS transistors' gates. That means the I2C logic is 3.3V
logic. R5 and R6 are also pull-up resistors for the 3.3V VDD.
5. I think the two NMOSes are
nothing but level converters. I2C signals from Arduino are 5V logic,
these two NMOSes will level them down to 3.3 V logic for the MAX30102
sensor.
6. For the operation of the
NMOS transistors, please take CE/E338 Digital VLSI Design in the Fall.
7. You don't need to handle
any Op Amp stuff here because everything is in DIGITAl, that's the
value of using ICs - the MA30102!
2. Pulse
Oxymetry
Reference
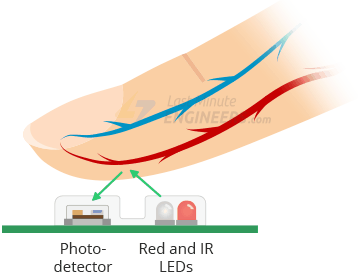
The MAX30102, or any optical
pulse oximeter and heart-rate sensor for that matter, consists of a
pair of high-intensity LEDs (RED and IR, both of different wavelengths)
and a photodetector. The wavelengths of these LEDs are 660nm and 880nm,
respectively.
The MAX30102 works by shining
both lights onto the finger or earlobe (or essentially anywhere where
the skin isn’t too thick, so both lights can easily penetrate the
tissue) and measuring the amount of reflected light using a
photodetector. This method of pulse detection through light is called
Photoplethysmogram. The working of MAX30102 can be divided into two
parts: Heart Rate Measurement and Pulse Oximetry (measuring the oxygen
level of the blood).
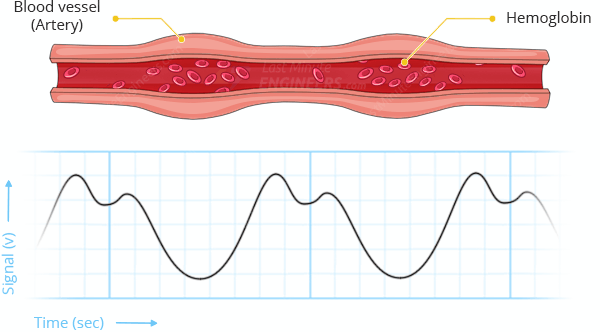
Heart Rate
Measurement
The oxygenated
hemoglobin (HbO2) in the arterial blood has the characteristic of
absorbing IR light. The redder the blood (the higher the hemoglobin),
the more IR light is absorbed. As the blood is pumped through the
finger with each heartbeat, the amount of reflected light changes,
creating a changing waveform at the output of the photodetector. As you
continue to shine light and take photodetector readings, you quickly
start to get a heart-beat (HR) pulse reading.
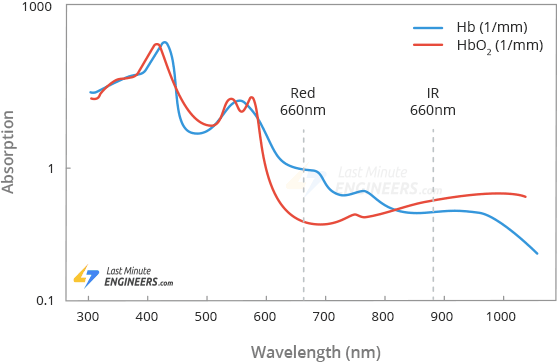
Pulse
oximetry
Pulse oximetry is
based on the principle that the amount of RED and IR light absorbed
varies depending on the amount of oxygen in your blood. The following
graph is the absorption-spectrum of oxygenated hemoglobin (HbO2) and
deoxygenated hemoglobin (Hb).
As you can see from the
graph, deoxygenated blood absorbs more RED light (660nm), while
oxygenated blood absorbs more IR light (880nm). By measuring the ratio
of IR and RED light received by the photodetector, the oxygen level
(SpO2) in the blood is calculated.
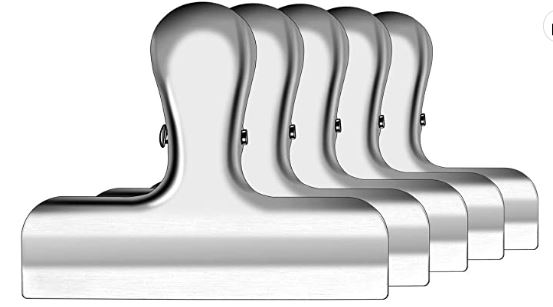
3. Design the product
I ordered the following clips. You can choose the one you would like to use:
https://www.amazon.com/gp/product/B07S3W5PZ8/ref=ppx_yo_dt_b_asin_title_o00_s00?ie=UTF8&psc=1

https://www.amazon.com/gp/product/B01F840KXO/ref=ppx_yo_dt_b_asin_title_o01_s00?ie=UTF8&psc=1
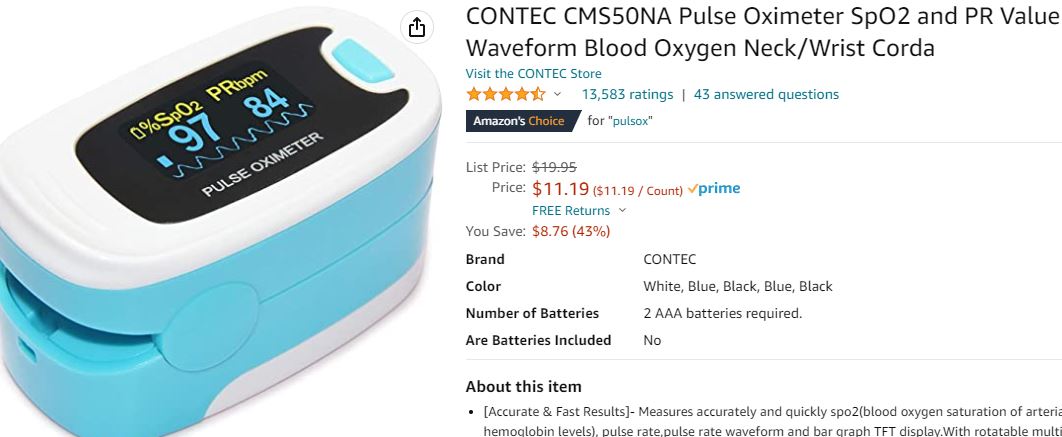
I also ordered the following product as a reference for you:
https://www.amazon.com/dp/B07F7Z2HZM?psc=1&smid=A3OO8CII929H74&ref_=chk_typ_imgToDp
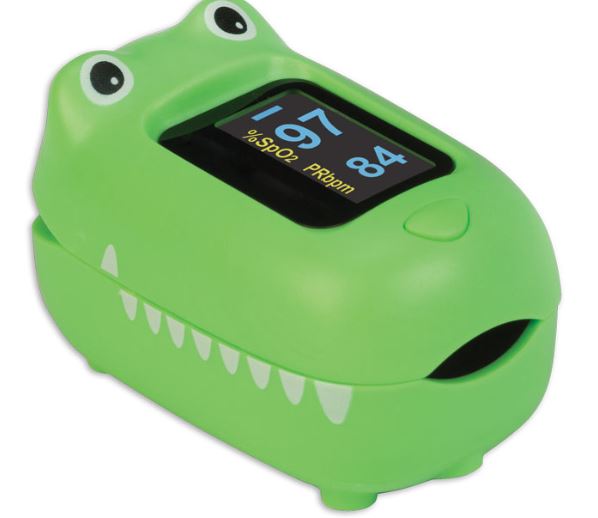
The goal in this section is
to design the PCB for this system and 3D print the container for the
board and the clip. The 3D printed container must consider artistic
desgin to attract teenagers. For example an alligator head, a bird
beak, a duck head, or a frog head.
---------------------
Tasks
Follow this
tutorial and finish the
following tasks
Task 1.
Show the following results (week 1, 20 points), due 8 am Wednesday 2/8
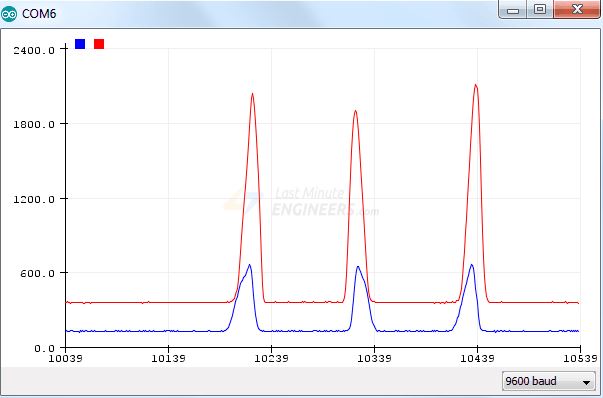
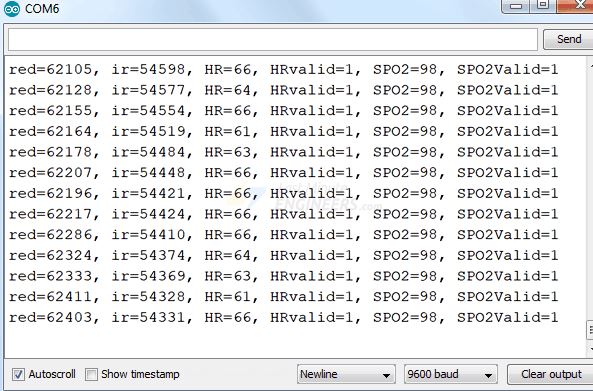
Red and IR lights in the
serial monitor
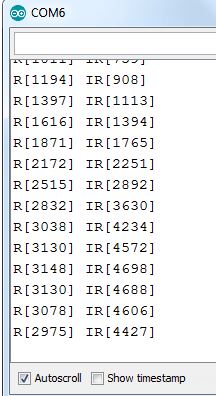
Red and IR reading in serial
plotter
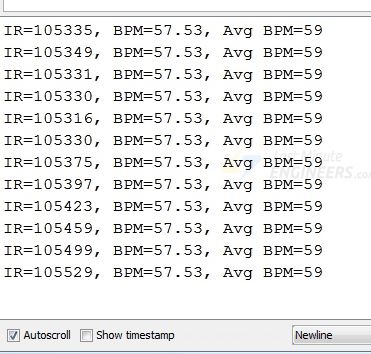
Measure heart rate (BPM)
Measure Measuring Oxygen
Saturation (SpO2)
Task 2 (week 1, 20 points), due 8 am
Wednesday 2/8
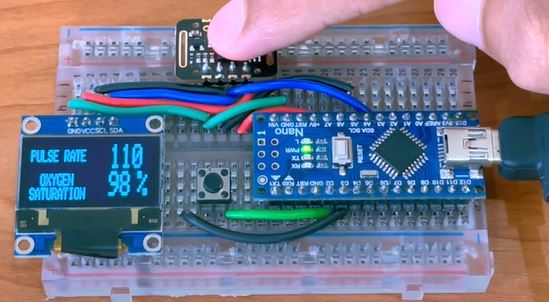
Follow this tutorial to display pulse rate and oxygen
saturation on one OLED display
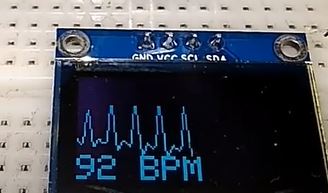
Task 3 (week 2, 30 points), due 8 am Monday 2/13
Use the MAX30102 and the
SSD1306 OLED module for this task.
This tutorial
uses a different sensor but you can borrow the code for the display
part. The goal is to show BPM, SPO2 and the waveform plot on the OLED
module at the same time.
Task 4 (week 2, 15 points), due 8 am
Friday 2/17
Generate a BOM (bill of
materials) spreadsheet to include all the parts that you need for the
project and the cost. Plan for a workshop for high school students. The
plan including:
1. How long is the workshop?
2. What are the final
products students are going to build?
3. What are the cost of
materials for each student?
4. How much would you charge
for each student?
5. How much profit you can
earn from this workshop if you have 20 students registered.
6. Design a flyer for this
event to attract participants. The drawings and art on the flyer must
be original work.
7. Design a webpage to
include a Dummy Paypal option on it for customers to checkout. A tutorial on
Paypal App. Use you CE351
page to do this.
You can also use GPay or
other Apps as long as it works.
Design a PCB of the system and send the Gerber files to me by email.
Task 5 (15 points) due 8 am Monday 2/27
Complete Section 3 in this tutorial. Assemble the board to the
container and demonstrate the functionality of the product. Upload the
report to the website.
Small steps and deadlines: (All the following tasks must be included in your report).
1. Wednesday 2/22, finish your first drawing
2. Wednesday 2/22 by 12 pm, new PCB submitted
3. Friday, 2/24 by midnight, drawing of the container completed
4. Monday, 2/27 print the parts
5. Monday, 2/27 print it. The container design and printing must be completed by midnight 2/27 for credit.
Here
is an example of a DIY product that is being sold all over the world.