Pulse oximetry is a
noninvasive method for monitoring a person's oxygen saturation (SO2).
In this lab, we are not testing SO2. When blood flushes to the finger
tip, the amount of blood changes and the absorbances of IR light
changes as well. If blood absorbs more IR light, the reflected IR light
being received by the receiver will decrease and so the voltage at the
Collector (C) terminal will increase. The heart beat rate is the same
as the frequency of the voltage pulses from the receiver.
1.
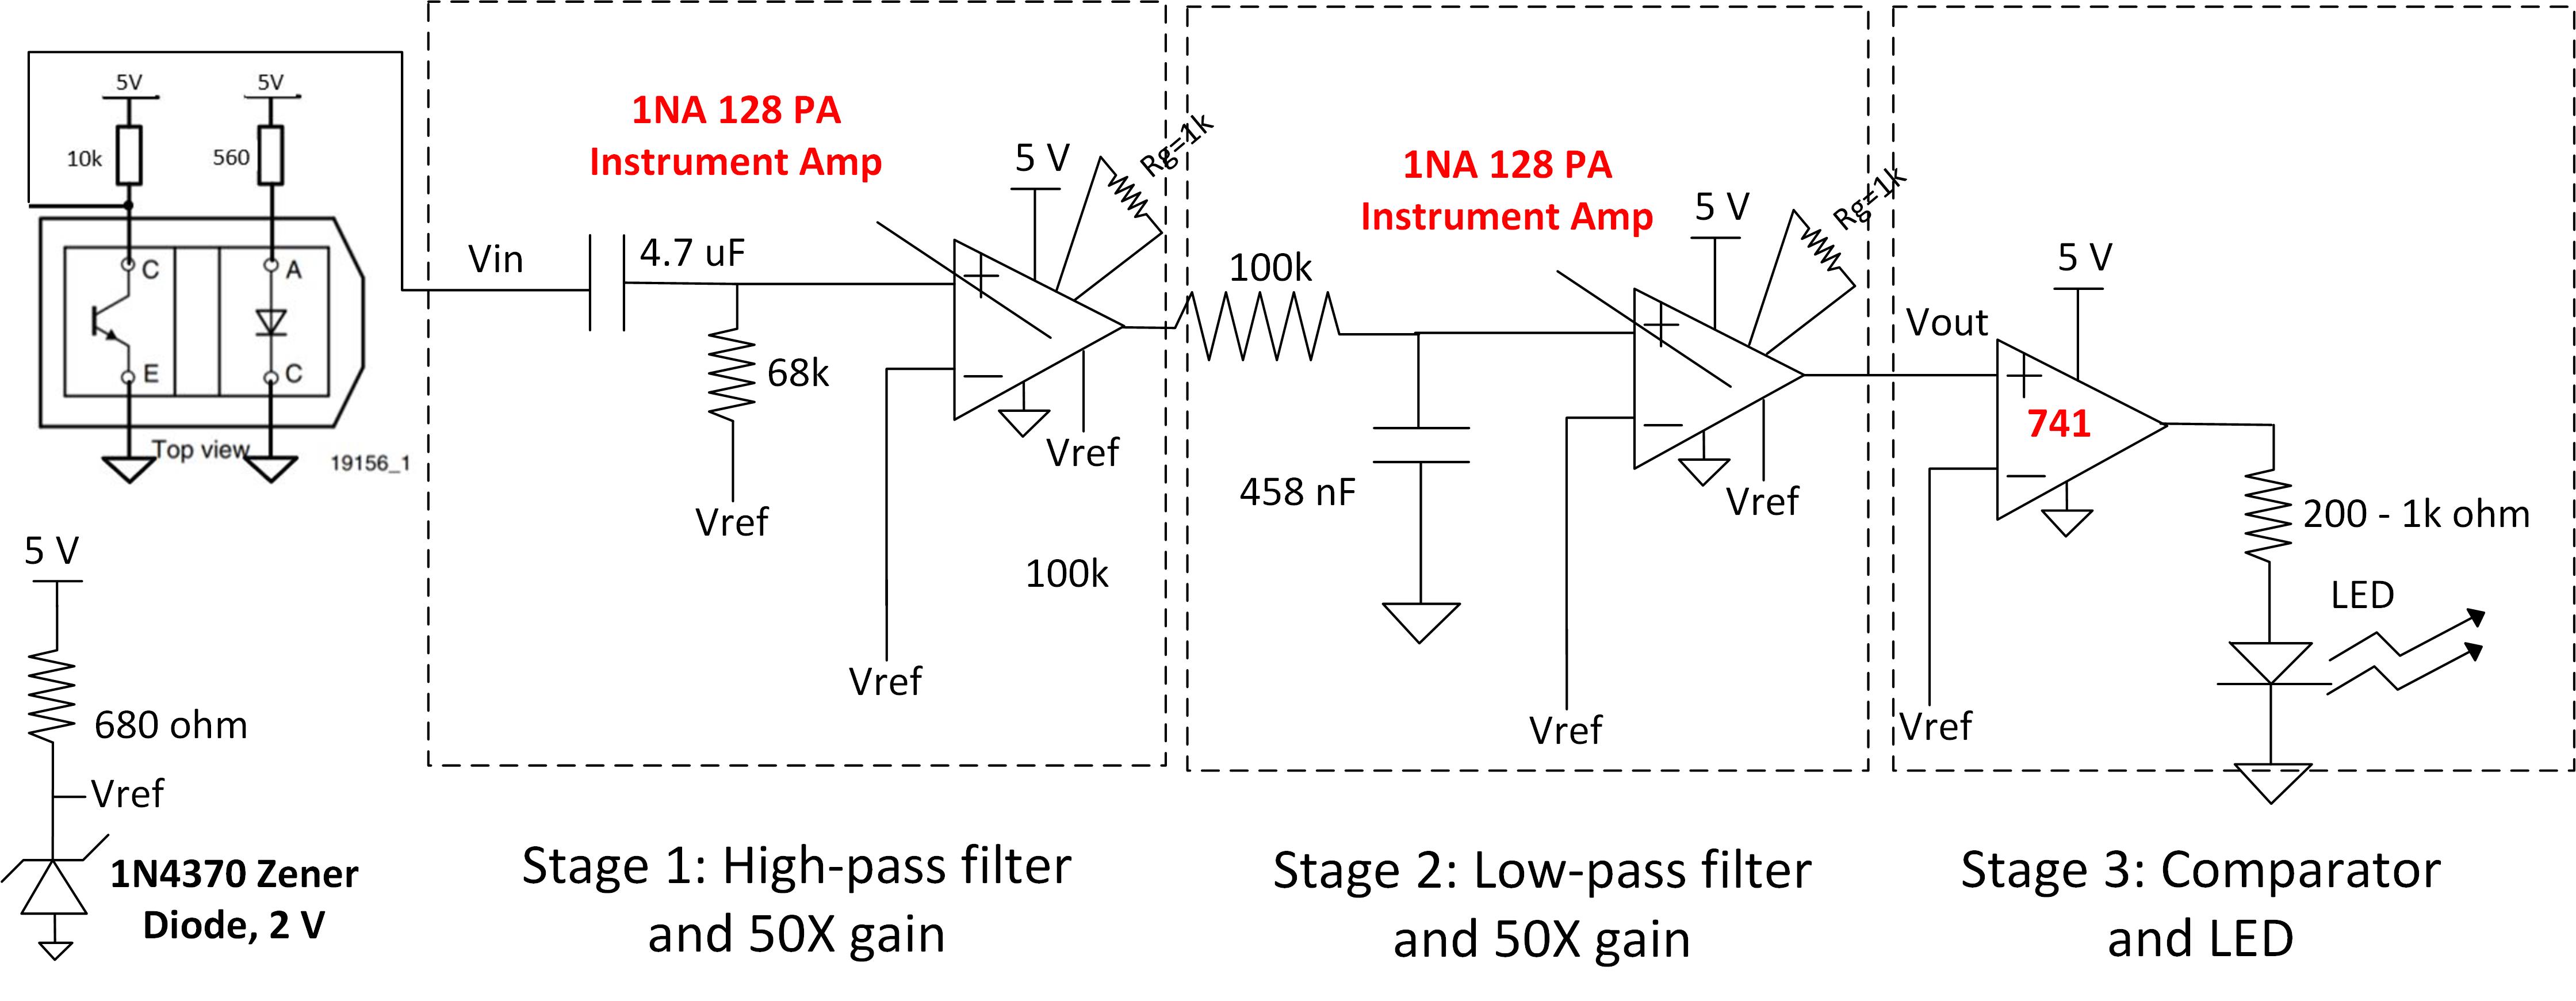
Use the TCRT5000 IR pair and the 1NA
128P instrumentation amplifier to build an oximeter.
The
datasheet of IR pairs available to you can be found here.
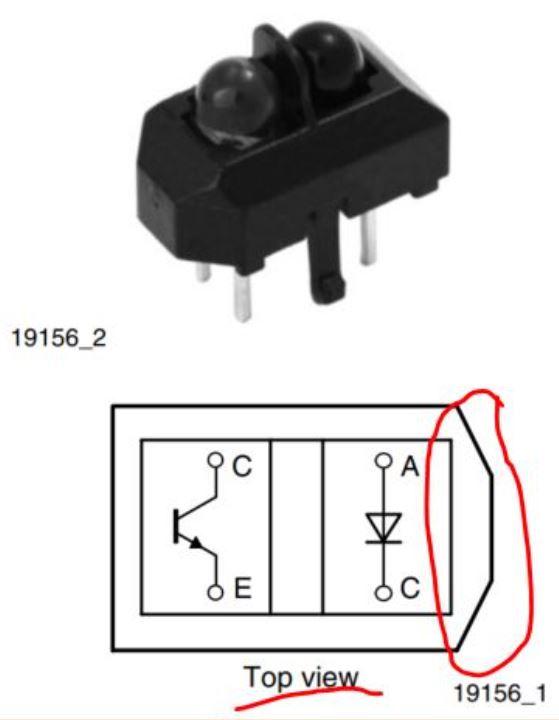
You
must find the polarity of
the pins by reading this datasheet carefully. It won't tell you how to
make connectiosn to the pins directly but you will find answers from a
few places on your own.
On
the first page of the datasheet, the following figures tells you the
polarity and the internal circuit of the IR pairs:
Task
1: Build the following circuit on your breadboard and probe the
input and output using an oscilloscope. Please note that the output is
the the output of the 741 Op Amp but the output of the second-stage 1NA
128P Op Amp.
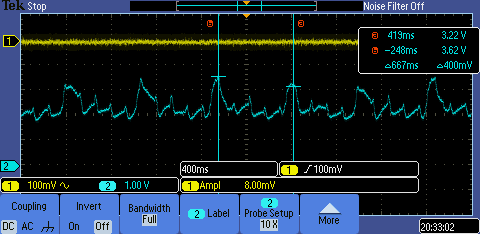
You should be able to see the
heart beat pulses (voltages) on your scope. Save the image and use
cursors to measure one of the peak-peak time period.
Watch the following demo video to understand this experiment better.
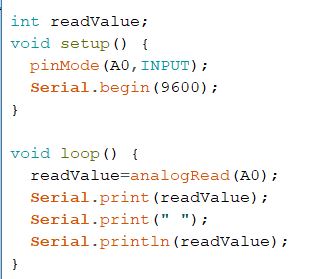
2. Use the 10-bit ADC on the Arduino UNO board to display the pulses.
Use A0 on the board for the analog input. Do not forget to ground your
signal to the GND of the Arduino board.
The arduino code is here:
The demo video is here:
Please note that I said use
Python to plot the data. You do not need to do that step. Just show a
video of your Serial Plotter and upload it to your YouTube Channel, and
instert the HTML to your Kompozer.
Task 2: Repeat my work in the YouTube video and show your video on your website.